Changes in China’s Purchasing and Import Trends between 2019 and 2024
China’s supply chain is moving away from the US.
Op/Ed by Chris Devonshire-Ellis
One aspect of the US-China trade war little commented on is the US$179 billion worth of goods that China purchased from the US in 2018. While much of the trade dispute talk has been on the amount that the US has been buying from China (US$557.9 billion) and the size of the trade deficit (US$378.6 billion), the smaller amount – China’s imports from the US – have been somewhat lost in all the noise.
However, China is a major purchaser of American products and services, and the on-going trade war will be having a long-term effect not just on US businesses buying goods in China and selling them back to the US, but also now on American manufacturers selling to the China market. It is a sizable share.
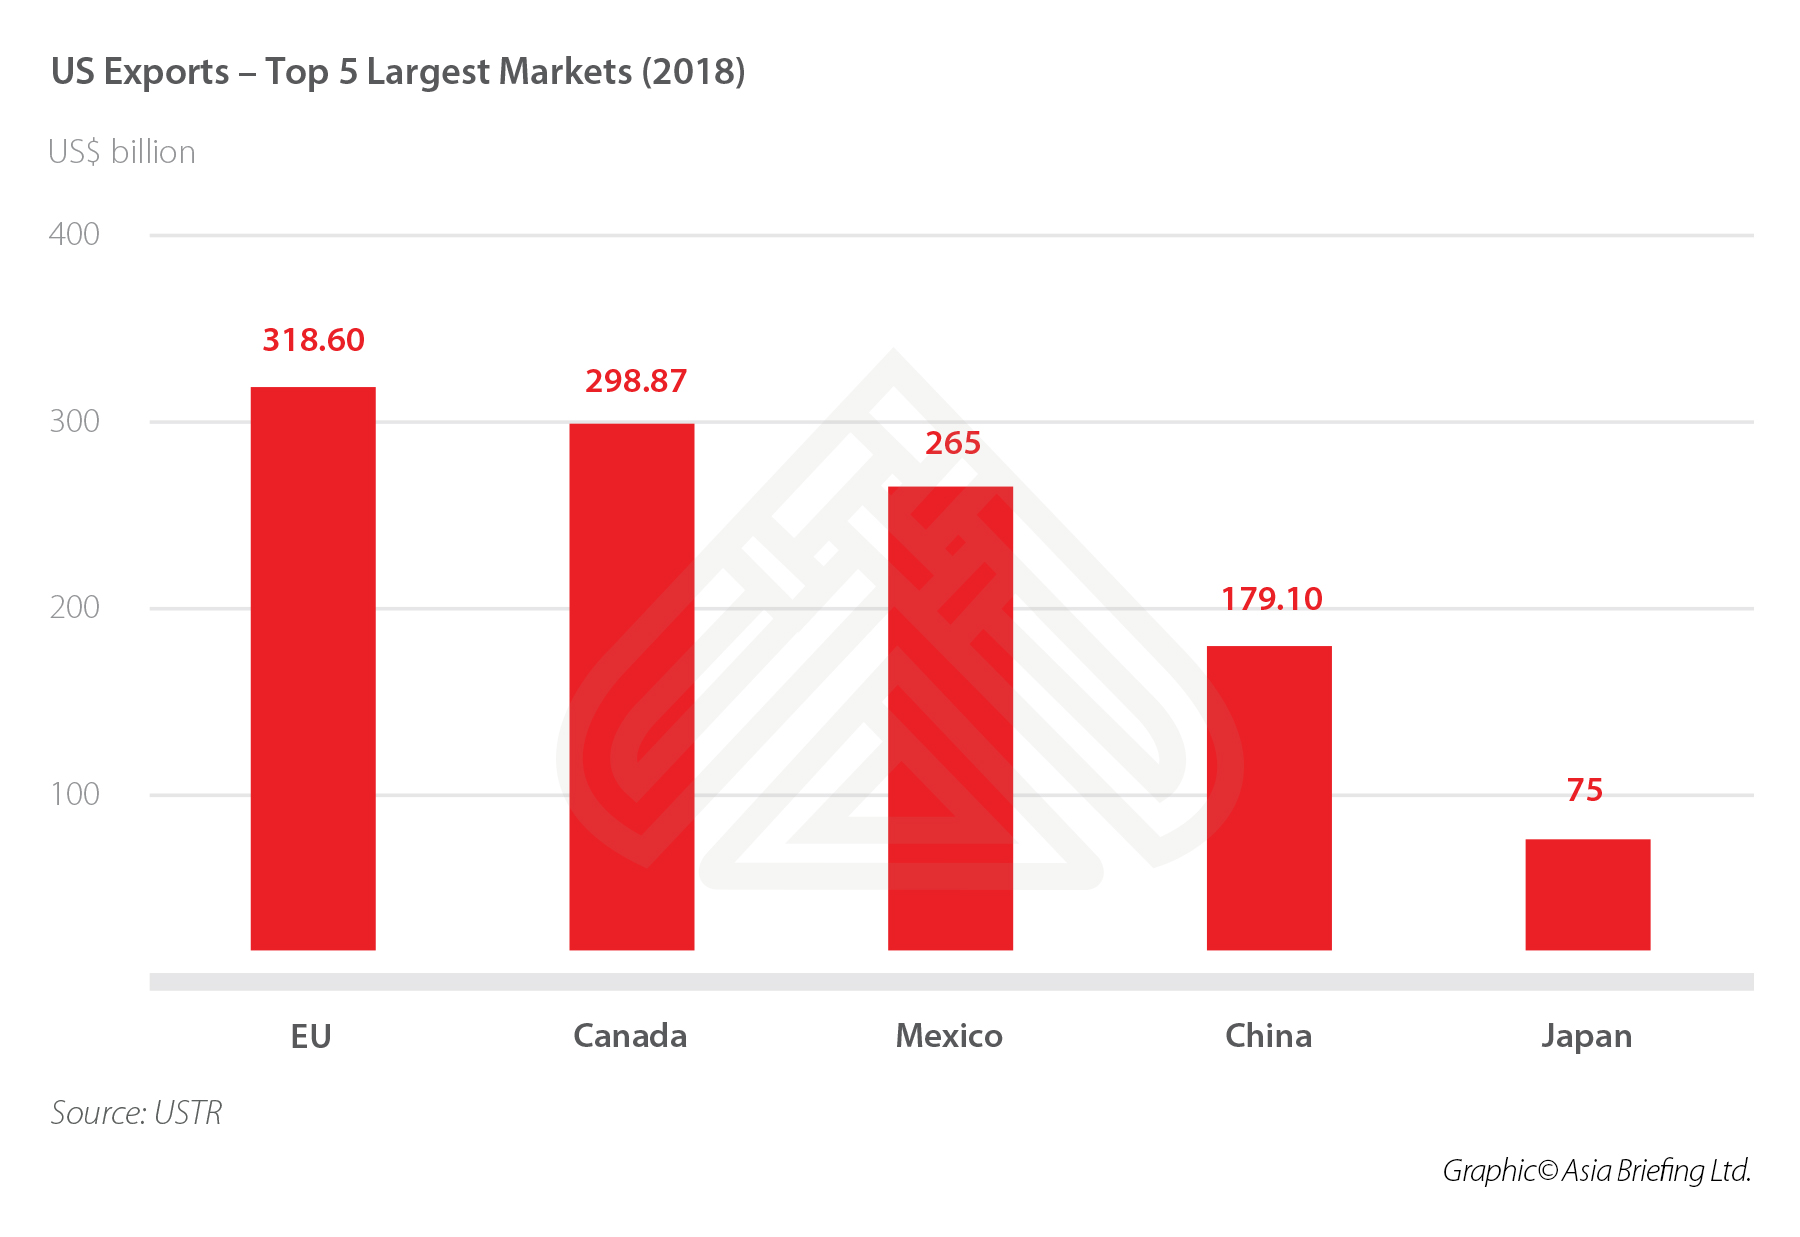
While China ranks fourth in purchasing goods and services from the US, there is a considerable gap between itself and Japan, which is in fifth place. Of the US product exports to China, aircraft, soybeans, motor vehicles, and microchips make up the bulk of trade. It is, however, exactly these areas that China has targeted in its retaliation against the US for imposing higher tariffs on Chinese goods entering the US market. However, as I pointed out in the article, China Ignores US Trade Threats, in general terms, the US actually only comprises roughly 20 percent of the global supply chain, albeit a larger share in the microchip industry where it still possesses technical advantages. But for nearly all other products and services, China has alternative suppliers. Additionally, China’s consumer base and that of other emerging markets – India, Russia, and Brazil – far outstrip that of the US. This means that it is not in China’s, or much of the global trade volume’s interest, to have too much trade dependency on the US – especially as Washington DC has begun using trade as a sanctions weapon, and increasingly since it first imposed sanctions on Russia back in 2014.
Global supply needs certainty – and Washington DC has essentially damaged the US’ own trade sustainability and credibility by picking fights and resorting to the use of sanctions, increased tariffs and the strength of the US dollar to punish countries it does not see following its wishes.
This means that the US-China trade war has provided not just China, but other nations, such as Russia with an opportunity to cut the US loose from the global supply chain, and especially from consumers in Asia, Eurasia, Africa, and to some extent South America. Yet, these are the growth markets of the coming three to four decades. The implications for US producers currently selling to China is that they will lose this market – permanently. The global supply chain is therefore shifting away from US control and to some extent, participation. But where is it heading?
ASEAN
ASEAN comprises the South-East Asian countries of Brunei, Cambodia, Indonesia, Laos, Malaysia, Myanmar, Philippines, Singapore, Thailand, and Vietnam. It has a population of 650 million and a GDP of US$2.92 trillion, with a combined GDP growth rate of 5.2 percent. China’s bilateral trade with ASEAN is currently growing at a rate of 10.5 percent per annum, while ASEAN’s exports to China are growing at a rate of 13.8 percent. China-ASEAN trade is growing amid new strategies by Beijing to increase commodity and technical supplies from the region. China’s State Council announced just on Monday that they would establish six new zones, specifically to encourage – which includes through tax incentives – companies from regional ASEAN and other border countries to supply China with more products. The ASEAN-influenced ones will be built near the borders of Vietnam, Laos, and Myanmar. There are additional reasons for China to do this – it has a comprehensive free trade agreement with ASEAN. In the first six months of this year, ASEAN became China’s second largest trade partner and sold more goods to China than the US.
European Union
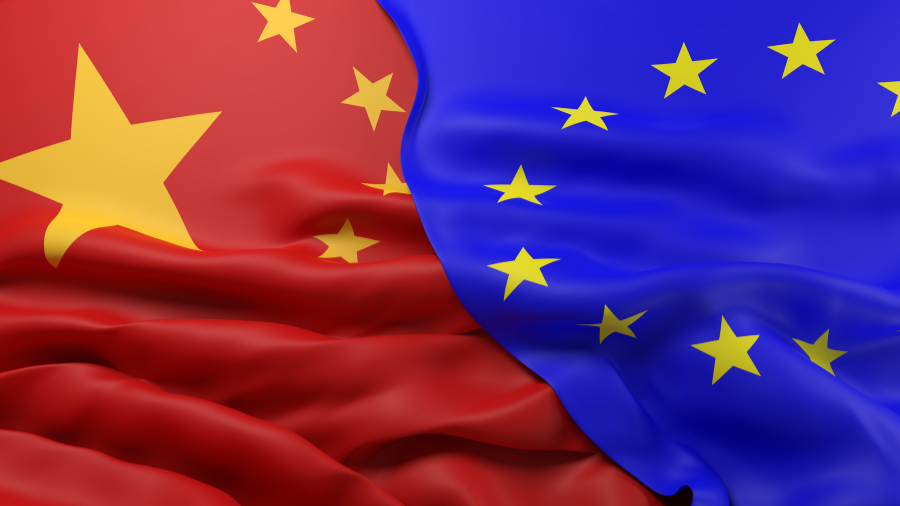
The EU is China’s largest bilateral trade partner and exported about US$232 billion in goods and services to China in 2018. The growth in exports from the EU to China is also growing, and specifically in the services industry. Growth in goods is currently hindered by the lack of an EU-China Free Trade Agreement. The relationship has leaned in particular on the trading of manufactured goods, which made 84 percent of the EU’s exports to China in 2018, specifically that of machines and vehicles, according to statistics released by Eurostat. Export growth is currently running at about four percent per annum. The departure of the UK in terms of EU trade with China accounts for about four percent of the EU total volume and is not expected to slow down the intrinsic growth rate in EU-China exports. However, the EU faces increasing competition from ASEAN nations selling products to China, which has already begun to sell more products and will sell twice as much to China than the EU in five years’ time – unless the EU can deal with its lack of progress on a China FTA.
India
India should be a major export partner for China, but a combination of political interference, lack of trust and initiative, and a disjointed and often discriminatory foreign investment program have nullified the trade relationship. India-China bilateral trade has declined by close to four percent with Indian exports to China running at less than US$8 billion per annum, and declining by 1.62 percent the past year. The situation is unlikely to resolve itself unless China and India can agree on bilateral trade, which means a resolution over Pakistan. That is not expected to occur. The China market by and large is passing India by and is instead now concentrating on developing ties with Africa. India has missed the selling to China opportunity it had a decade ago by prevaricating and being obsessed with too many internal, rather than external trade affairs.
Africa
Africa-China trade received a significant boost this year with the signing of the African Continental Free Trade Agreement, which has obliterated tariffs on 90 percent of all goods traded between most African nations. Chinese companies have been huge investors in Africa and they are now set to benefit from this by using the AfCFTA deal to significantly boost exports back to China. African exports to China now top US$100 billion with growth rates of over 30 percent per annum. How long that is sustainable is a moot point; however, it is worth noting that China’s exports to ASEAN achieved similar growth rates for a few years following the signing of the ASEAN-China FTA, before then leveling out. Africa is set to be the big winner as China looks at importing from alternative sources.
Russia
Russian exports to China are on a steep upward curve and hit US$56 billion last year, an increase from US$39 billion in 2017. The country is the world’s largest grain producer and a move from US to Russian suppliers will hit American farmers hard. Other exports Russia makes to China are in energy, which is also producing new technologies and will see the products and services Russia provides to China diversify in future years. The two countries are currently negotiating products to be included in the Eurasian Economic Union free trade agreement, which China signed off last year. Bilateral trade is currently about US$100 billion with a fairly even balance, this is widely expected to grow at 20 percent per annum for the next five years, having overachieved against this for the past three years.
Belt and Road countries
China has signed MoU with over 150 countries globally with its Belt and Road Initiative. Tracking the export progress of these is complicated by the fact that many of them are also members of other trade blocs, such as the EU, ASEAN, and EAEU. This distorts the overall figure as I include these blocs anyway in my trade analysis. In trying to get a picture of the BRI countries that are part of China’s BRI but not included within the various trade blocs, I have stripped out various statistics provided for by MOFCOM and China’s customs as concerns imports.
For example, in this exercise I omit any BRI countries that are part of any current major trade bloc, except those that are junior partners within such entities. For example, Cambodia, Laos, Myanmar, and Vietnam are included from ASEAN as these were the four countries given a later date for ASEAN trade compliance. On the other hand, Brunei, Indonesia, Malaysia, Philippines, Singapore, and Thailand’s figures have been stripped out of the Belt and Road trade figures as they crop up anyway in ASEAN’s total.
Stripping out the larger, more established nations from China’s overall trumpeting of its BRI trade volumes reveal that BRI export volume to China in these emerging countries, while significant, is experiencing low growth volumes at present, and especially from BRI investments made into Europe, the Middle East, and South America. There are bright spots in China’s Belt and Road in terms of the developing ASEAN markets, such as Cambodia and Vietnam, as well as Africa, but overall the BRI still needs time to be a fast growth and productive market. This will become more positive as much-needed infrastructure investment kicks in and makes trade connectivity easier and in some cases, opens up new trade corridors. But for now, the emerging Belt and Road Initiative in terms of export volumes to China is still a developing market.
I roughly estimate that market – which I detailed in the article, The Emerging Markets in China’s Belt and Road Initiative – to be worth about US$150 billion as at 2019. That is against China’s customs recent announcement that the entire Belt and Road Initiative nations are currently exporting about US$650 billion worth of goods and services to China. But as mentioned, that also includes figures from well-established trade partners and isn’t especially indicative of BRI infrastructure developments taking place that can be taken advantage of. Hence my discounting the trade volume to cater for the collective impact of developing trade arriving from smaller nations whose BRI infrastructure development is providing a boost in overall trade and GDP growth.
The emerging BRI markets are, in essence, a work in progress and China’s own bet of where future trade flows will later develop. Some basic number-crunching on a per country basis reveals the emerging Belt and Road countries to have export volumes growing at about three percent per annum. However, they will effectively equal the amount of produce currently exported by the US to China within the next five years.
Based on today’s export trends, we can project, should these prove sustainable, the growth of exports to China and where they will come from over the next five years. On the negative side, the US can expect to lose nearly 30 percent of its total export trade to China by 2024, with Russian exports to China edging ahead of the US that same year. The EU can be expected to maintain its current position despite the loss of UK export volume to China (at US$17 billion). China’s affiliation with the Belt and Road Countries can be expected to develop, with the current large total volume of goods growing at a steady three percent rate per annum. By 2024, China’s trade with the emerging Belt and Road countries will be at levels similar to that of the volume imported from the US today. A big winner is Africa, which has just agreed to an Intra-African Free Trade deal, and armed with this, will see African exports to China rise significantly. The African growth in exports to China may be projected to be high, however, they broadly mirror the export growth rates between ASEAN and China in the early stages of the China-ASEAN FTA. African free trade export volumes to China can be expected to overtake those of the US in three years.
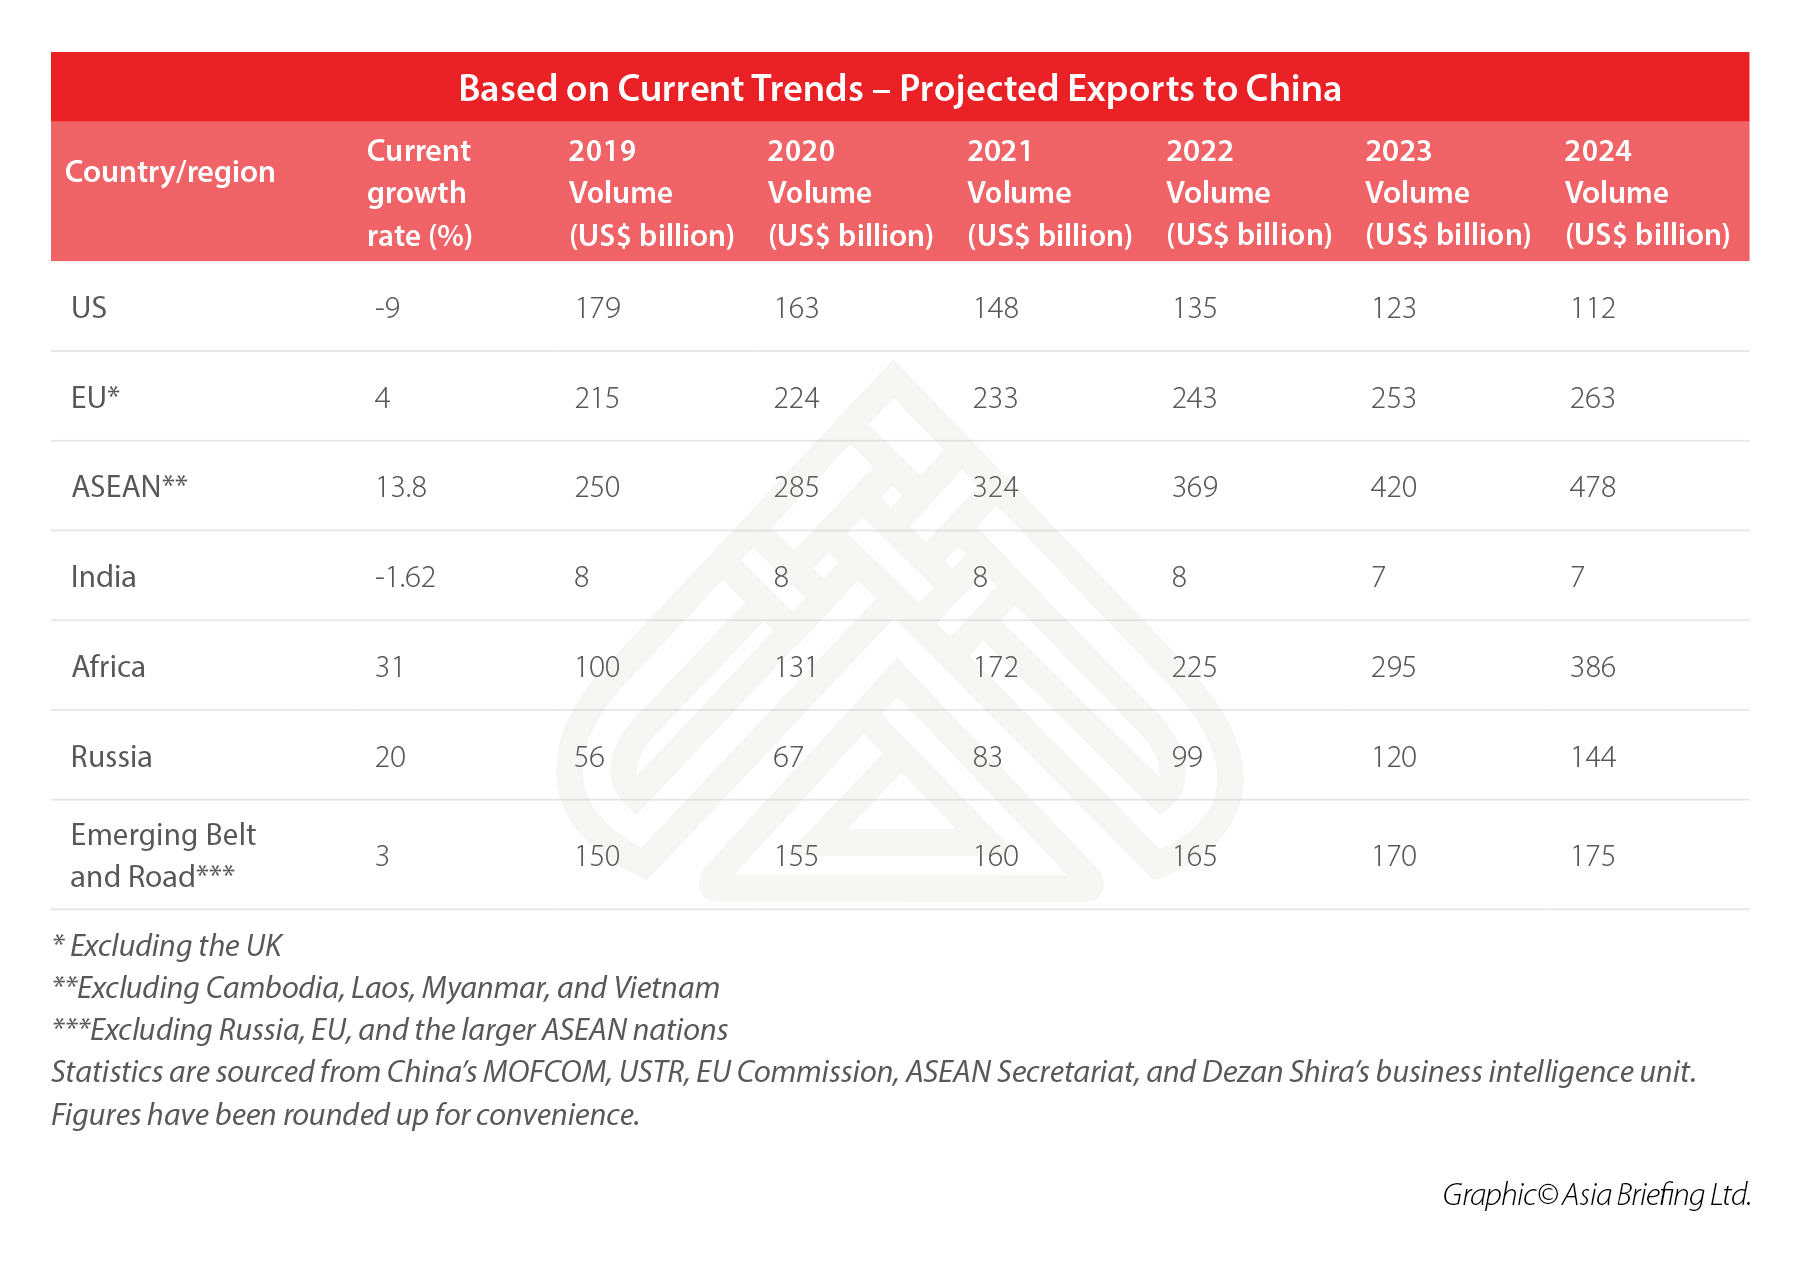
These figures, while based on assumptions and basic projections, do present something of a pointer into where China’s balance of trade is likely to go in the short to medium term. They suggest a move away from trans-continental trade with North America and bringing trade back home into China’s own sphere of influence. Not unlike President Trump’s stated desire to see manufacturing return from China to the US, China appears to be doing the same thing, but in reverse, in trade – bringing it back home to Asia while developing regions, such as Africa and its own Belt and Road platform.
The figures illustrate that by as soon as 2021 – just over two years from now – China’s growth in import volumes from other sources than the US will have amounted to US$201 billion – more than the amount exported by the US to China today. It indicates that China is well able to adapt and do without the US in its entirety. Sobering thoughts for US companies looking to sell product to China.
They also illustrate the strong emergence of Africa as a major supplier to China, along with ASEAN, the EU, Russia, and the emerging Belt and Road countries. This is food for thought as to where infrastructure developers should be looking to get involved in developing the new global supply chains, and especially those essentially feeding into China.
About Us
China Briefing is written by Dezan Shira & Associates. The firm has 27 years of experience across Asia and advises foreign investors and governments on doing business within the region. Our Business Intelligence services division can be hired to dig into trends. For more information, please contact as at asia@dezshira.com or visit us at www.dezshira.com.
- Previous Article Indonesia’s New Tax Incentives, Due Diligence in Vietnam – China Outbound
- Next Article Hong Kong vs Singapore: What’s Next for Foreign Investors in Asia


